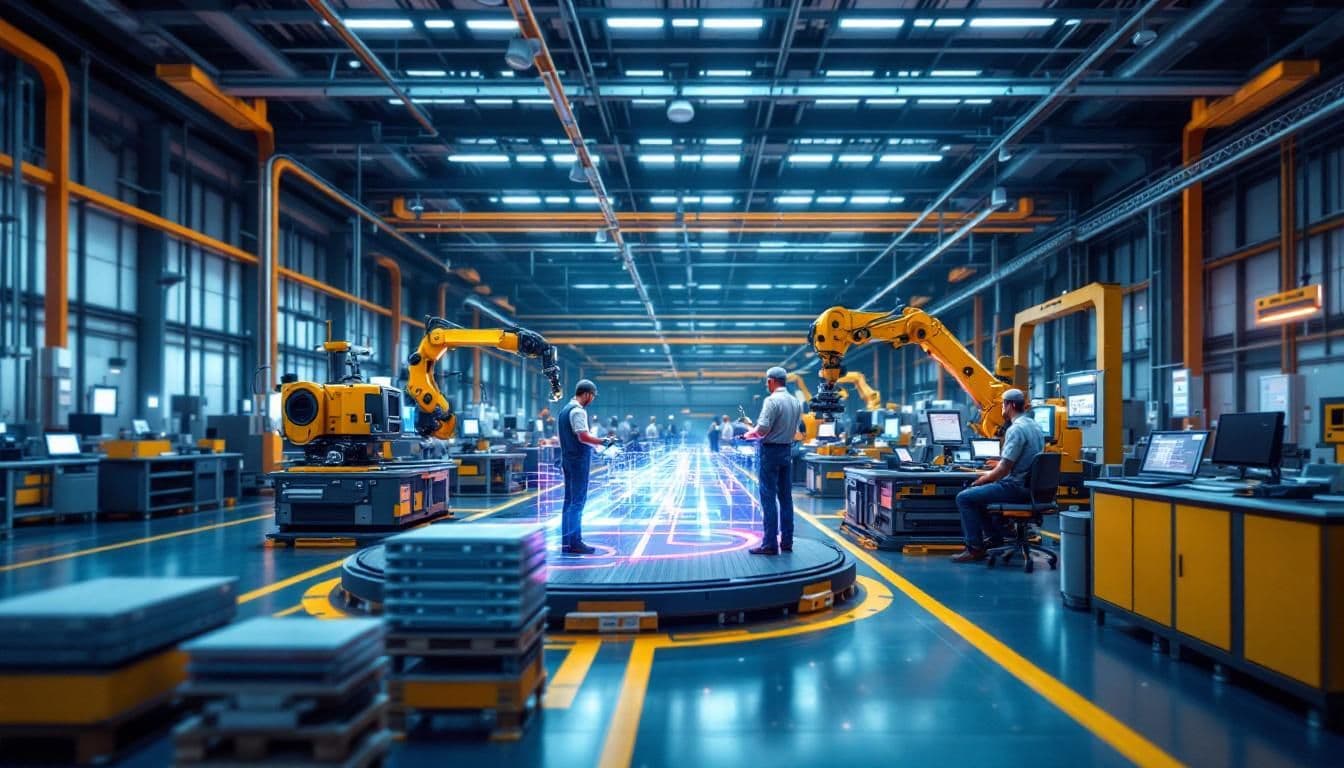
Use [computer vision](/glossary/computer-vision) cameras to continuously monitor warehouse inventory levels in real-time, detecting stockouts, misplaced items, and potential theft. Triggers automatic replenishment orders and identifies inventory discrepancies before they impact operations. Reduces manual cycle counting and improves inventory accuracy. Essential for middle market distribution and e-commerce fulfillment centers. Autonomous mobile robot navigation employs simultaneous localization and mapping algorithms processing [LiDAR](/glossary/lidar) point-cloud scans and stereo-depth camera feeds, maintaining centimeter-precision digital warehouse floor plans that dynamically update slot-occupancy states, aisle obstruction detections, and pallet-stacking height compliance measurements. Computer vision warehouse inventory optimization deploys autonomous mobile robots equipped with optical sensors, depth cameras, and barcode/RFID scanning apparatus to perform continuous inventory surveillance, slot utilization assessment, and picking path optimization across distribution center and fulfillment facility environments. These vision-guided systems replace periodic manual cycle counting with perpetual inventory verification that maintains real-time stock accuracy without disrupting ongoing warehouse operations. Autonomous inventory scanning robots navigate warehouse aisle corridors using simultaneous localization and mapping algorithms, capturing high-resolution imagery of rack locations, bin positions, and floor storage areas. Optical character recognition reads carton labels, pallet placards, and location identifiers while [object detection](/glossary/object-detection) models enumerate visible inventory quantities, classify product categories, and detect damaged packaging requiring disposition processing. Shelf gap analysis algorithms compare observed inventory presence against warehouse management system expected slot assignments, identifying discrepancies indicating misplaced inventory, phantom stock records, and unrecorded replenishment completions. Discrepancy resolution workflows automatically generate investigation tasks for warehouse personnel, prioritized by financial impact magnitude and order fulfillment risk urgency. Slotting optimization engines analyze product velocity profiles, dimensional characteristics, weight [classifications](/glossary/classification), and affinity groupings to recommend optimal storage location assignments that minimize picker travel distance, reduce ergonomic strain from heavy lifting at improper heights, and concentrate frequently co-ordered items in proximate locations facilitating efficient wave picking execution. Occupancy utilization monitoring quantifies volumetric space consumption across rack positions, mezzanine levels, and floor staging zones through three-dimensional point cloud analysis. Congestion heat maps identify bottleneck areas where aisle traffic density impedes throughput, informing workflow resequencing and physical layout reconfiguration decisions. Pick path optimization algorithms construct travel-minimized route sequences for order fulfillment associates using traveling salesman problem heuristics adapted to warehouse topological constraints including one-way aisle traffic rules, equipment availability at specific locations, and priority zone access restrictions. Wearable augmented reality displays overlay navigation guidance and pick instructions onto workers' visual fields, reducing search time and selection errors. Receiving dock inspection modules capture inbound shipment imagery for quantity verification, damage documentation, and compliance assessment against purchase order specifications. Automated receiving discrepancy reports compare delivered quantities and conditions against expected shipments, triggering supplier chargeback processes for shortages and damages without manual inspection bottlenecks. Safety surveillance modules detect warehouse hazard conditions including obstructed emergency exits, unstable pallet stacking, aisle obstruction violations, and personal protective equipment non-compliance through continuous [video analytics](/glossary/video-analytics). Real-time safety alert generation enables immediate corrective intervention before hazardous conditions result in worker injury incidents. Seasonal [capacity planning](/glossary/capacity-planning) simulations model inventory volume projections against available warehouse cubic footage, labor availability, and equipment capacity to forecast peak period operational constraints. Overflow warehouse activation triggers, temporary labor requisition timelines, and extended operating hour schedules derive from simulation outputs. Photogrammetric volumetric estimation calculates cubic displacement measurements from stereoscopic depth camera triangulation, enabling automated freight dimensioning that eliminates manual cubing station bottlenecks. Planogram compliance verification compares shelf-facing merchandise arrangements against merchandising schematics through template matching algorithms detecting stock-keeping unit position deviations.
Inventory tracked manually through barcode scanning at receiving/shipping. Physical cycle counts required monthly (warehouse closed for 1-2 days). Stockouts discovered only when picker tries to fulfill order. Inventory shrinkage (theft, damage, misplacement) discovered during annual physical count. No visibility into real-time inventory levels or bin locations. Inventory accuracy typically 85-90%.
Computer vision cameras monitor all warehouse zones 24/7. AI identifies products on shelves using visual recognition (packaging, barcodes, labels). Tracks inventory movements and bin locations in real-time. Detects low-stock situations and triggers replenishment alerts. Flags discrepancies (item in wrong location, unexpected removal from shelf) for investigation. Eliminates need for manual cycle counts. Inventory accuracy improved to 98%+.
High upfront investment in camera infrastructure and AI system. Requires extensive product training data (images of every SKU from multiple angles). Lighting conditions and camera positioning critical to accuracy. Cannot see inside closed boxes or opaque containers. Integration with WMS (warehouse management system) complex. Privacy concerns monitoring warehouse workers. System may struggle with very similar-looking products.
Start with pilot in limited warehouse zones (high-value items) before full deploymentBuild comprehensive product image library before go-liveUse barcode scanning as backup for items AI can't visually identifyImplement strict data privacy controls for worker monitoringRegular calibration and accuracy audits comparing AI to physical countsPartner with specialist warehouse automation integrator
Initial investment ranges from $50,000-$200,000 depending on warehouse size and camera density, with ongoing software licensing at $2,000-$5,000 monthly. Most facilities see ROI within 12-18 months through reduced labor costs and improved inventory accuracy. Hardware costs decrease significantly when integrated during facility upgrades or expansions.
Typical deployment takes 8-12 weeks including camera installation, AI model training on your specific products, and system integration with existing WMS/ERP platforms. The first 2-4 weeks involve hardware setup, followed by 4-6 weeks of AI training and calibration. Phased rollouts by warehouse zone can reduce disruption and allow for iterative improvements.
You'll need robust Wi-Fi or ethernet connectivity throughout the warehouse, adequate lighting (minimum 300 lux), and integration capabilities with your current WMS or inventory management system. Most systems require edge computing hardware for real-time processing and cloud connectivity for AI model updates. Existing barcode or RFID systems enhance but aren't mandatory for basic functionality.
Primary risks include initial AI accuracy issues with similar-looking products, potential system downtime affecting inventory visibility, and employee resistance to automated monitoring. Poor lighting conditions or frequent warehouse layout changes can reduce system effectiveness. Mitigation involves thorough testing periods, backup manual processes, and comprehensive staff training on the new technology.
Track key metrics including inventory accuracy improvements (typically 15-25% increase), reduced cycle counting labor hours (often 60-80% reduction), and decreased stockout incidents. Calculate savings from prevented lost sales, reduced safety stock requirements, and faster order fulfillment times. Most facilities achieve 200-300% ROI within two years through operational efficiency gains and improved customer satisfaction.
Explore articles and research about implementing this use case
Article
AI courses for manufacturing companies. Modules covering quality management documentation, safety compliance, operations optimisation, and supply chain intelligence with AI.
Article
Manufacturing AI costs: Predictive maintenance $100K-$600K, quality control $120K-$500K, production optimization $150K-$700K. IIoT integration and OT/IT challenges.
THE LANDSCAPE
Discrete manufacturers produce distinct units like cars, electronics, and machinery using assembly lines and component-based processes. AI optimizes production scheduling, predictive maintenance, quality inspection, and supply chain coordination. Manufacturers implementing AI reduce downtime by 35%, improve quality control accuracy by 90%, and increase throughput by 25%.
The global discrete manufacturing market exceeds $8 trillion annually, encompassing automotive, aerospace, consumer electronics, and industrial equipment sectors. These manufacturers face intense margin pressure, complex multi-tier supply chains, and rising quality expectations from customers demanding zero-defect products.
DEEP DIVE
Key technologies transforming discrete manufacturing include computer vision for automated defect detection, machine learning for demand forecasting, digital twins for production simulation, and robotics for flexible assembly. IoT sensors enable real-time equipment monitoring across factory floors. Cloud-based MES and ERP systems provide end-to-end visibility from raw materials to finished goods.
Inventory tracked manually through barcode scanning at receiving/shipping. Physical cycle counts required monthly (warehouse closed for 1-2 days). Stockouts discovered only when picker tries to fulfill order. Inventory shrinkage (theft, damage, misplacement) discovered during annual physical count. No visibility into real-time inventory levels or bin locations. Inventory accuracy typically 85-90%.
Computer vision cameras monitor all warehouse zones 24/7. AI identifies products on shelves using visual recognition (packaging, barcodes, labels). Tracks inventory movements and bin locations in real-time. Detects low-stock situations and triggers replenishment alerts. Flags discrepancies (item in wrong location, unexpected removal from shelf) for investigation. Eliminates need for manual cycle counts. Inventory accuracy improved to 98%+.
High upfront investment in camera infrastructure and AI system. Requires extensive product training data (images of every SKU from multiple angles). Lighting conditions and camera positioning critical to accuracy. Cannot see inside closed boxes or opaque containers. Integration with WMS (warehouse management system) complex. Privacy concerns monitoring warehouse workers. System may struggle with very similar-looking products.
Our team has trained executives at globally-recognized brands
YOUR PATH FORWARD
Every AI transformation is different, but the journey follows a proven sequence. Start where you are. Scale when you're ready.
ASSESS · 2-3 days
Understand exactly where you stand and where the biggest opportunities are. We map your AI maturity across strategy, data, technology, and culture, then hand you a prioritized action plan.
Get your AI Maturity ScorecardChoose your path
TRAIN · 1 day minimum
Upskill your leadership and teams so AI adoption sticks. Hands-on programs tailored to your industry, with measurable proficiency gains.
Explore training programsPROVE · 30 days
Deploy a working AI solution on a real business problem and measure actual results. Low risk, high signal. The fastest way to build internal conviction.
Launch a pilotSCALE · 1-6 months
Roll out what works across the organization with governance, change management, and measurable ROI. We embed with your team so capability transfers, not just deliverables.
Design your rolloutITERATE & ACCELERATE · Ongoing
AI moves fast. Regular reassessment ensures you stay ahead, not behind. We help you iterate, optimize, and capture new opportunities as the technology landscape shifts.
Plan your next phaseLet's discuss how we can help you achieve your AI transformation goals.